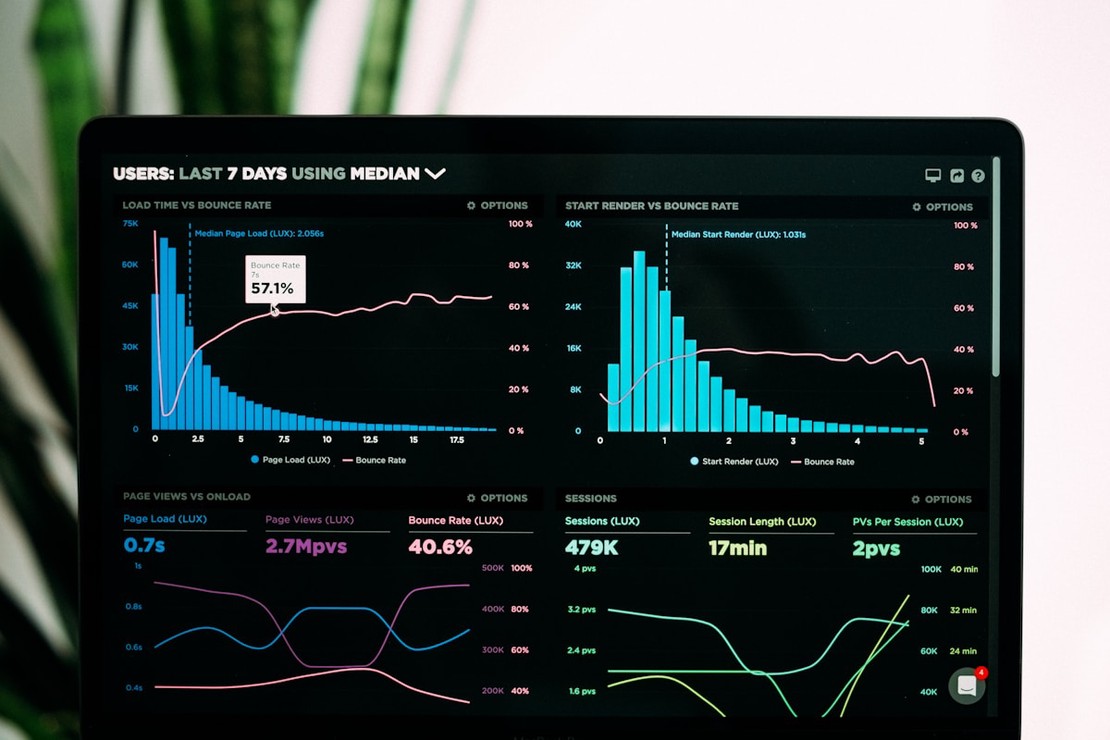
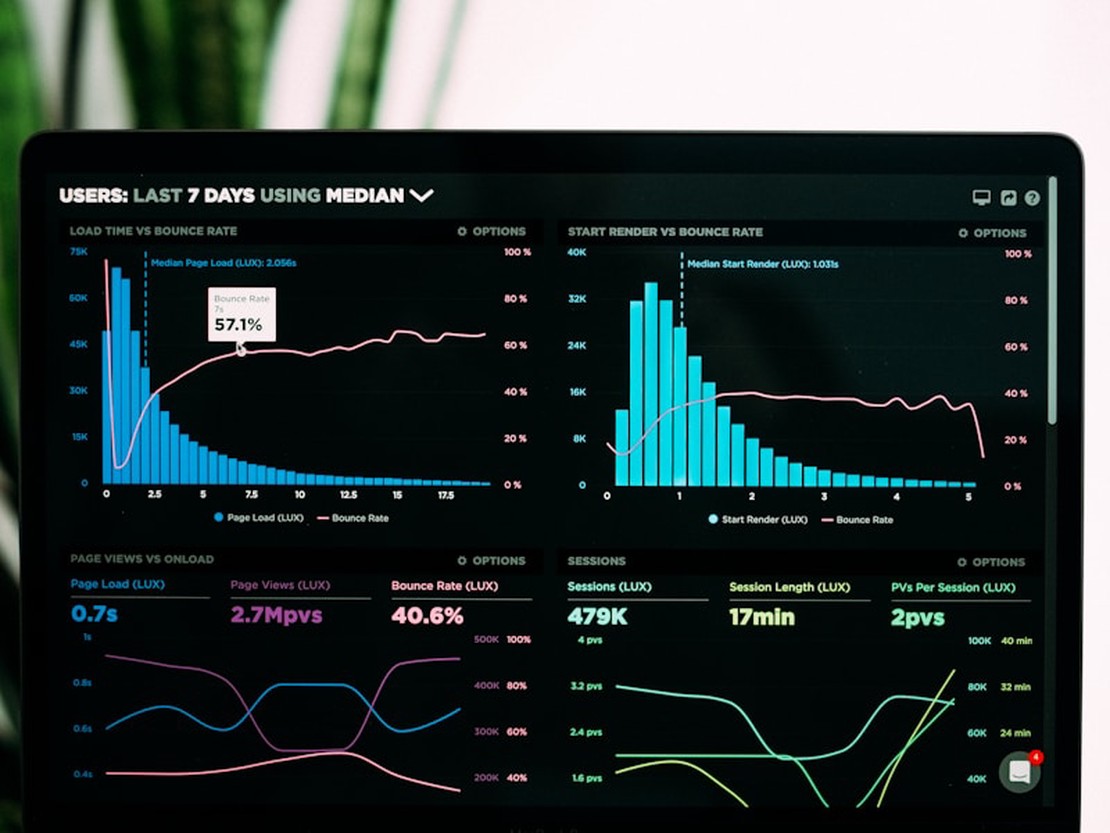
We see what’s slowing down your application
We use profiling tools to identify bottlenecks in code and infrastructure.
- CPU, memory, and I/O profiling in production environment
- Runtime heap analysis, garbage collection tuning
- API and database response time analysis
- N+1 query identification, memory leaks, and inefficient algorithms


